DATAWWWIZ
Overview
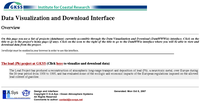
DATAWWWIZ (Data Visualization and Download Interface) is a dynamic WWW interface, developed by O.A.Sys, for the visualization and retrieval of geophysical data. Its purpose is to provide a tool that enables institutions to easily make data sets (e.g. observations or model data) accessible and, on the other side, to allow users to browse through available data sets and select, display and download all or specific sub-sets of variables from a project.
 The interface is dynamic in two respects. For the administrator or data provider, it allows the easy management of available projects and data sets by simply editing a few text files (project description, data set description, path to data set) and by ingesting the data (NetCDF or GRIB/Grads) into an xml file using a convenient command line tool. For the user, this list of projects/data sets is then presented upon entry to the data portal, using the project and data set descriptions from the text files and the self-describing xml data file.
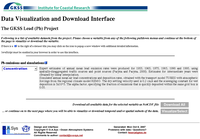
 The interface dynamically lists all variables contained in a chosen project/data set.
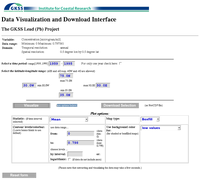
 Upon selection of a particular variable, the user is then presented with a form where the spatial and temporal extent of the variables are displayed (which are, again, dynamically read from the data files). The data, or a sub-region or sub-period thereof, can then be either downloaded as a NetCDF file or visualized.
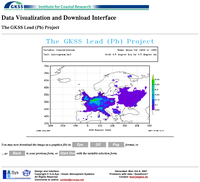
 If the user chooses to display the variable, various statistics (e.g. mean, standard deviation) and plot options can be selected. The image is then generated dynamically on-the-fly, and can also be saved in the eps, gif or png graphics formats.
We are currently extending and adapting the interface for the HIPOCAS reconstruction of sea state, water levels and currents at GKSS.
DATAWWWIZ is written in Python and makes use of the Python htmlgen module, the CDAT Climate Data Analysis Tools, and GrADS.
